← Back to all work Growth · 2025

MORII · Recovering 34%
of lost conversion

We used data to locate the leak, then ran 11 A/B tests to lift add-to-cart → payment conversion from 2.1% to 2.8%.

ClientMORII
IndustryBeauty DTC
ServicesGrowth
Timeline3 months
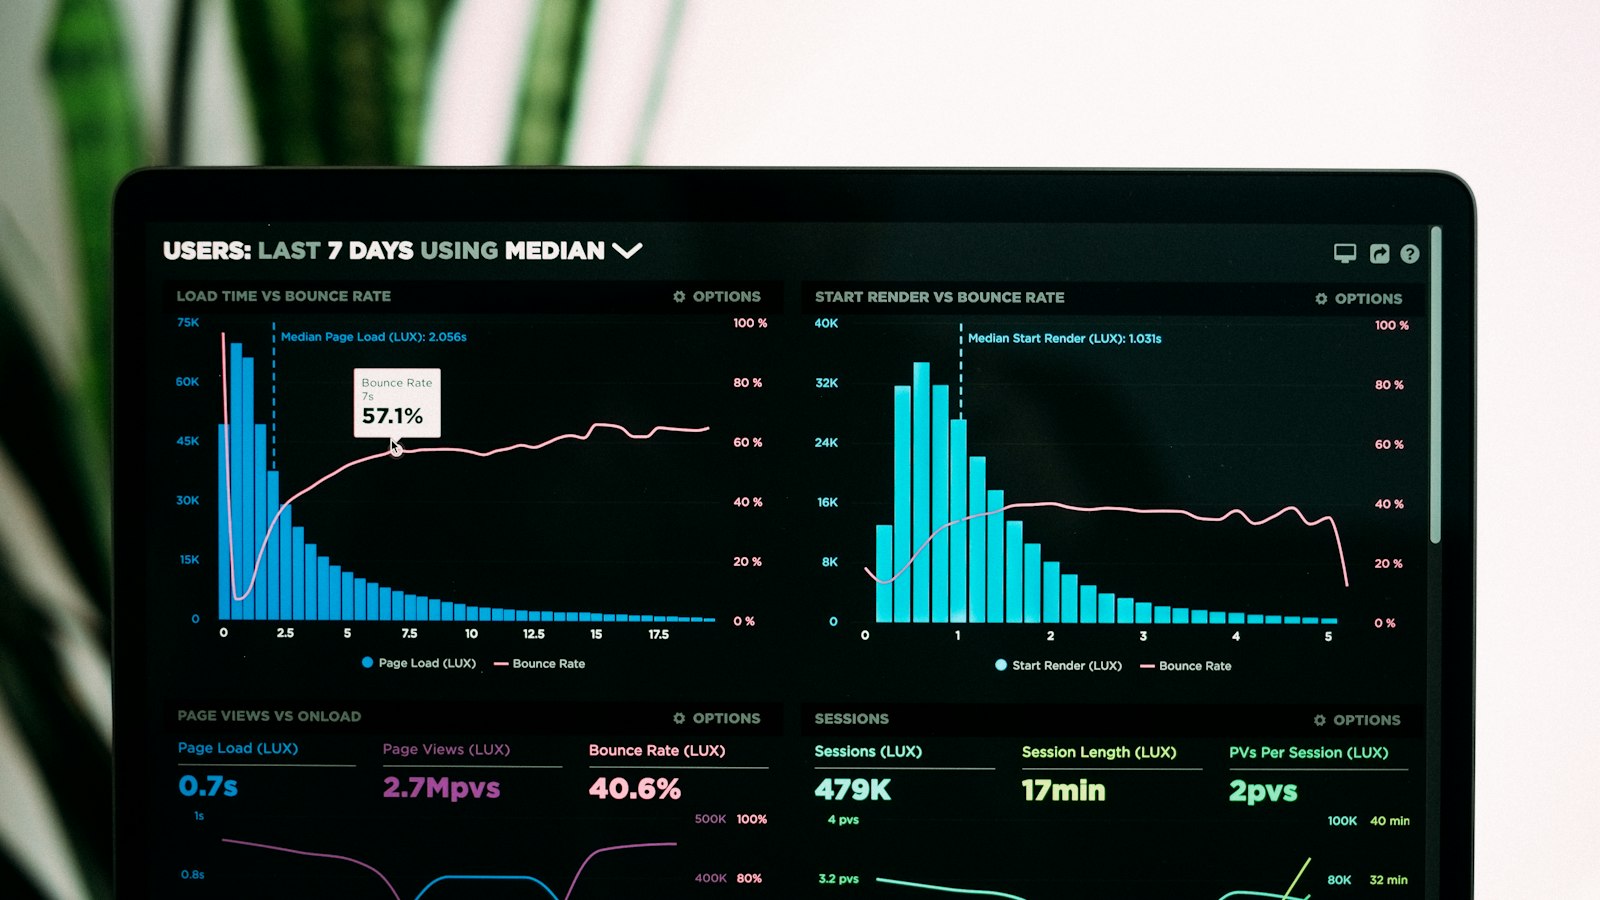
MORII growth analytics dashboard
Background

Traffic wasn't the issue — knowing where it leaked was

MORII is a DTC beauty brand with steady monthly actives and healthy ad ROI. But 68% of users who added to cart never reached payment.

Internally there were more than 20 “I think it's here” guesses: shipping costs, payment methods, sign-up friction, the coupon field…

The problem wasn't a lack of ideas — it was not knowing which one to validate first.

What we had to solve
  • Blind spots: analytics stopped at page level, so nobody could see which interaction people were stuck on.
  • Too many hypotheses: 23 to validate, no way to prioritise, changes made on instinct.
  • Random iteration: no control group, so after launch nobody could tell whether a change worked.
Our approach

See it before you build it

For three months we did one thing: replaced guessing with testing. Every change had a hypothesis, a control and a conclusion.

01

Analytics coverage

Analytics moved from page level down to 14 key interaction points — the first clear view of where people dropped off.

02

Funnel audit

We isolated two leaks — unclear shipping costs and payment methods hidden behind a toggle — accounting for 41% of drop-off.

03

Prioritisation

We used the ICE model to cut 23 hypotheses down to six, putting resources where the impact was.

04

A/B iteration

11 tests over three months, four winners, all folded into the design guidelines and dev docs.

+34%Payment conversion lift
11A/B tests (4 winners)
-19%Add-to-cart drop-off
“The hard part isn't running tests, it's knowing what to test first. They got the order right.”— Head of Growth, MORII

See other projects

Every case below runs on the same way of working.